


5 Game-Changing Use Cases for Football Tracking Data - And Why They Matter for Performance Teams
In the early 2000s, football was already evolving from an art to a science, as clubs started experimenting with GPS vests to monitor player workloads. But tracking data, in its infancy, was limited mainly to basic metrics - distance covered, top speed, total sprints. It provided insight, but only to a point. The real breakthrough came with advances in optical tracking systems that could capture every movement on the pitch, from player positioning to intricate play patterns, measured in unprecedented detail.
Over the years, clubs and leagues of all levels have integrated tracking technologies as part of their performance infrastructure. Yet, there remains a significant gap between data collection and actionable insights. Many organisations possess the mechanisms to gather data but lack the framework or expertise to translate it into meaningful outputs. Knowing a player ran 10 kilometres in a match is useful; understanding how, when, and where that energy was expended is transformative.
Today, tracking data systems have progressed beyond simple statistics. Through optical tracking, our technology captures player positioning and movement with a precision of 25 to 50 frames per second. This resolution allows for a far deeper understanding of tactical, physical, and technical performance, but only if it’s harnessed effectively.
While some clubs are at the cutting edge, leveraging these insights to fine-tune their game models, others are still collecting data without a clear strategy on how to use it. This disconnect is what we at Respo.Vision aims to address, providing not just the technology but the frameworks and expertise to convert data into tangible competitive advantages.
Below, we explore five pivotal use cases where tracking data is reshaping the game, empowering performance teams to enhance decision-making and drive results.
Fitness & Intensity Metrics
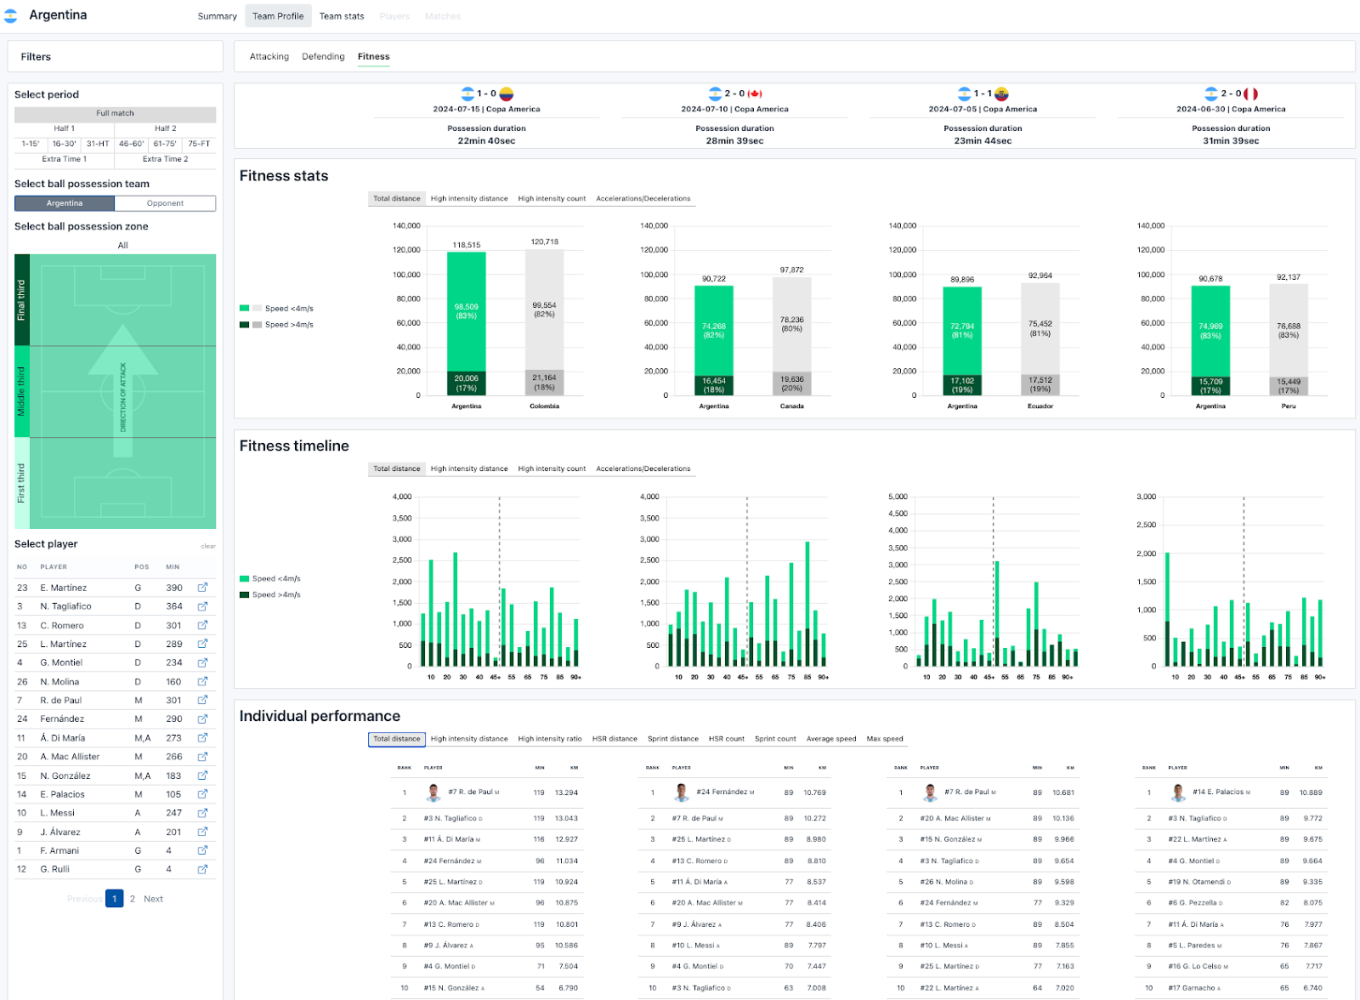
Fitness and intensity metrics provide a clear window into how much a player exerted themselves during a match. This includes total distance covered, high-intensity runs, sprints, and frequency of accelerations or decelerations, all of which help performance teams assess a player’s physical load. Importantly, this data doesn’t just confirm who ran the most; it highlights how, when and where physical effort was distributed, offering contextual information of where and when players made their runs instead of just clear numerical values provided by other tracking systems.
Why It Counts:
Football is about balancing skill, conditioning, and recovery. Whether it’s monitoring a midfielder's fading sprint intensity or gradually reintroducing a winger post-injury, tracking data enables evidence-based training load management. The result? Reduced injury risk, sharper conditioning, and more informed tactical decisions. This data is particularly useful for performance teams who rely on this data throughout the week. After a match, they evaluate whether players met their physical targets, identify overexertion risks, and use those insights to guide individualised recovery protocols. Ahead of the next fixture, coaches can make informed decisions about who to start, who to rest, and who might be primed for a late-game impact role based on current fitness profiles. In a high-stakes fixture list, this data can to an extent protect a squad from crumbling under the weight of its schedule.
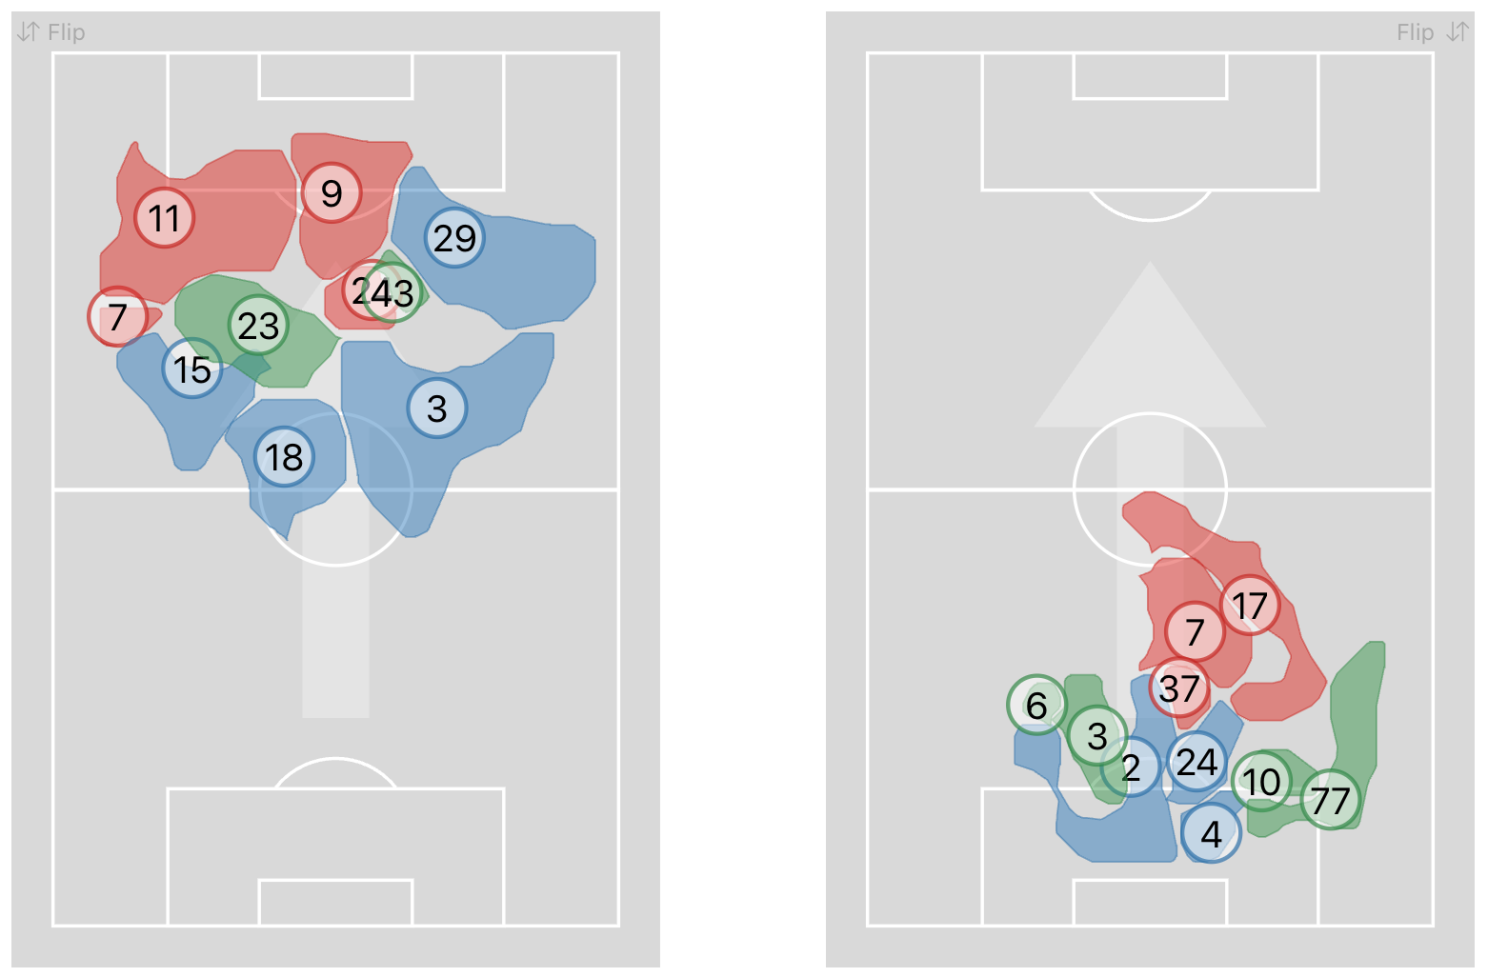
Heat-Maps & Running Visualisations
Heat-maps and running visualisations translate positional tracking data into intuitive visuals, showing where players spent most of their time and how they moved across the pitch. These visuals reveal more than effort; they expose patterns, tendencies, and positional discipline. A player may be assigned to operate in the right channel, but heat-maps may show they consistently drift wide or cut in too early, disrupting the team’s spacing and buildup shape.
Turning Insight Into Action:
This use case is particularly valuable when cross-referencing game plans with actual execution. If a coach has instructed the full-backs to invert during possession, the heat map will either validate that instruction or show a disconnect between strategy and behavior. Likewise, movement maps over time can reveal when and where a team was most active and whether those periods of intensity aligned with effective phases of play.
In weekly performance workflows, heat-maps are heavily used in both review and preparation. After matches, coaches and analysts dissect whether players operated in the intended zones and how those movements impacted team dynamics. In preparing for upcoming games, the same tools are used to analyze opponents — identifying areas they habitually vacate or overload. For example, if a team’s full-backs consistently push high and wide, leaving the half-space behind exposed, a smart analyst will flag that as a transition trigger zone.
Pressing & Defensive Intensity
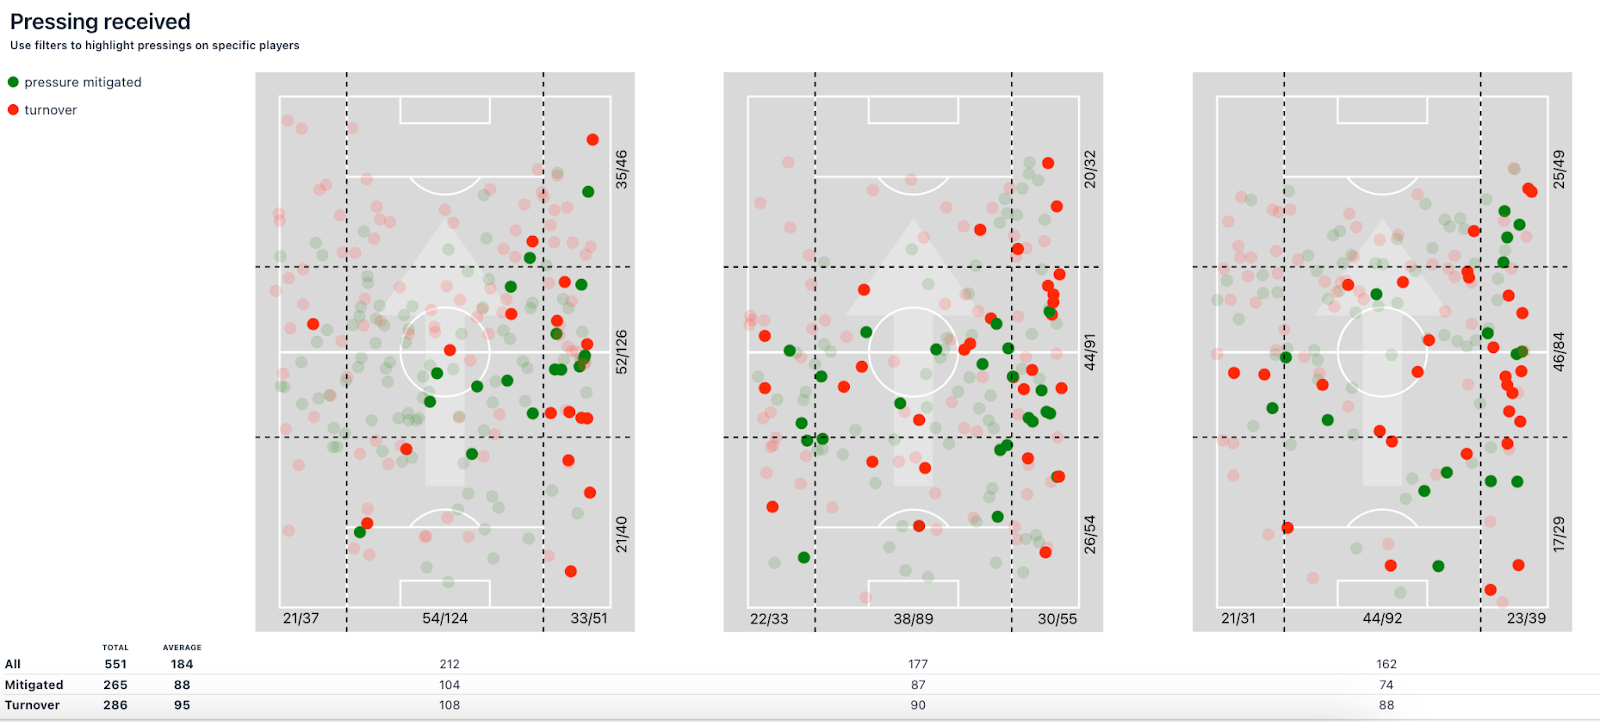
Pressing is one of the most physically and tactically demanding behaviours in modern football - but defining and measuring it at a team level remains complex. At Respo.Vision, we focus on a more tangible layer: individual defensive pressures applied on the ball carrier. By capturing where and when a player engages an opponent in possession, we provide objective, high-resolution insights into pressing behaviour without relying on subjective assumptions about team shape or intent.
The Practical Impact:
Understanding individual pressing efforts helps teams build a clearer picture of how defensive intensity is applied across the pitch. For instance, how often does a defender close down the ball carrier? In which zones? What’s the immediate outcome: does it force a pass backwards, disrupt tempo, or lead to a turnover?
On a weekly basis, this data is invaluable. After matches, analysts can review key sequences - perhaps a midfielder applies pressure consistently but too late to be effective, or a forward initiates pressing actions without adequate support. Pre-match, coaches can use these metrics to study opponents: which players struggle under pressure, where they tend to lose possession, and how pressure affects their decision-making.
The ROI for performance teams is in driving smarter defensive actions. Rather than pressing constantly, players learn to press selectively and with purpose: reducing unnecessary effort and increasing the likelihood of disrupting build-up play or forcing transitions in dangerous areas. While defining team pressing structures still requires coach-specific context, individual pressure data is a solid foundation to build from.
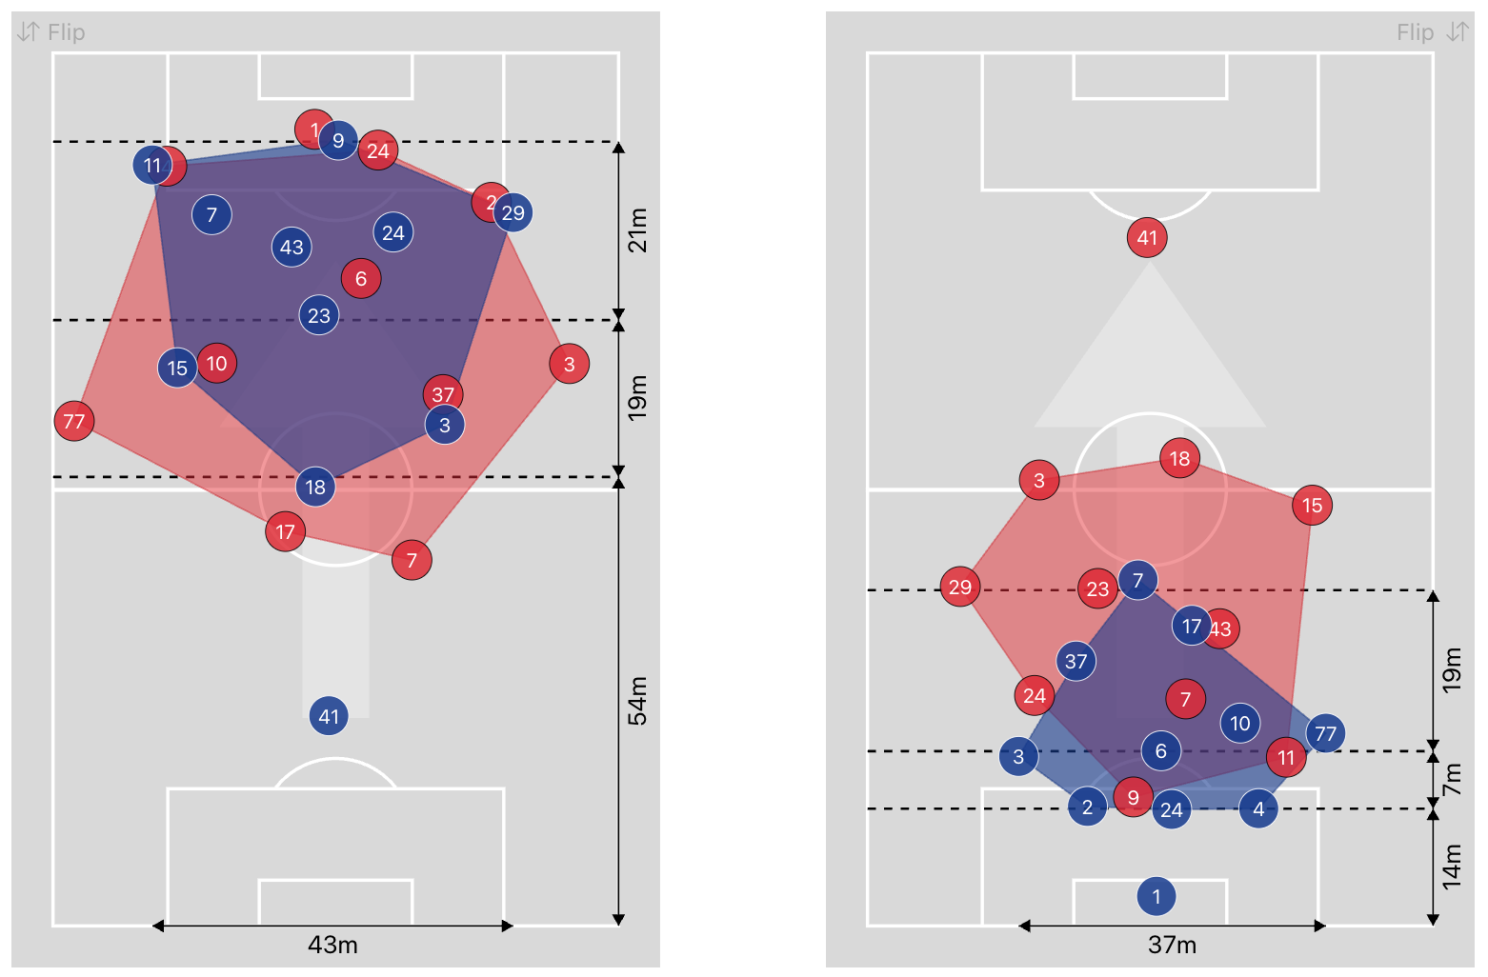
Shapes & Team Formations
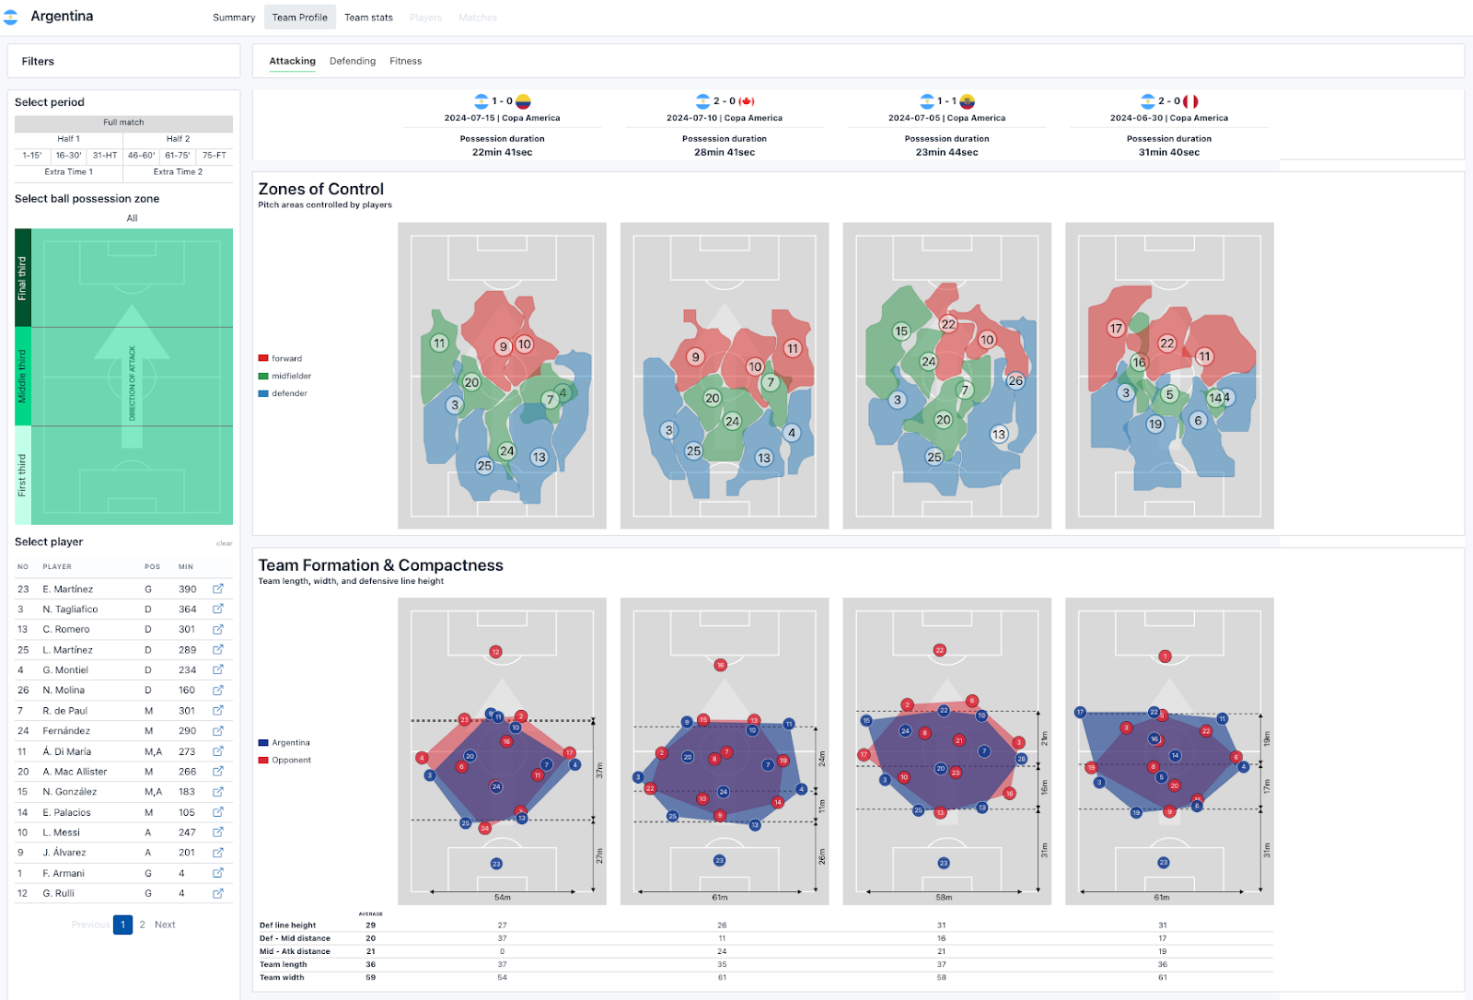
While formations like 4-3-3 or 3-5-2 are useful as shorthand, they rarely represent how a team functions during live play. Tracking data allows coaches to observe how formations evolve in different phases — attacking, defending, and transitioning — and whether the intended shapes are actually materialising. For example, a team might defend in a 4-4-2 mid-block but transition into a 2-3-5 in possession, with full-backs tucking inside and central midfielders pushing high.
What Teams Gain:
This level of insight is critical for evaluating team compactness, both horizontally and vertically. By monitoring the distance between defensive, midfield, and attacking lines, coaches can assess how effectively a team is limiting passing lanes, controlling tempo, and maintaining structural balance.
In practice, this data is deeply embedded into both post-match debriefs and pre-match modeling. Analysts can highlight where shape breakdowns occurred - for instance, the backline may have held its position while the midfield pushed forward, creating a vulnerable 20-meter pocket. These kinds of spacing issues can be flagged, addressed, and corrected in training.
Ahead of upcoming matches, shape-tracking data also informs preparation. It helps teams anticipate how opponents might shift under pressure, offering valuable clues on when and where to press, break lines, or isolate specific defenders.
The return on investment is clear: better tactical awareness, more effective real-time coaching interventions, and a consistent execution of the game model across 90 minutes.
Team Performance Analysis
Team performance analysis takes a step back from individual metrics and looks at the team as a single, coordinated organism. Using tracking data, analysts can assess team centroids (the average position of the team), spacing between lines, movement synchronisation, and how well units shift in response to ball movement. It's a high-level view of how organised or chaotic a team is, especially in transition.
Making It Matter:
Throughout the week, this data feeds directly into post-match sessions to analyse coordination - such as whether the pressing line was too narrow or if the backline failed to track runs as a unit. In the lead-up to matches, analysts study the opposition’s patterns — spotting moments where their forward line disconnects too quickly from midfield, for example - and use that intelligence to shape tactical plans, such as when to attempt line-breaking passes or exploit overloads.
For performance teams, the benefits are evident in the form of reduced tactical disorganisation, more targeted training around unit synchronisation, and greater control over the rhythm and flow of a match through compact, cohesive play.
Final Thoughts
At ReSpo.Vision, we work closely with clubs and performance teams every day, and we’ve learned that the challenge isn’t just collecting tracking data; it’s knowing what to look for and why it matters.
That’s why we’ve built our technology and services to go beyond just numbers. We focus on clarity, context, and accessibility - helping performance teams turn movement into meaning. Whether it’s informing recovery strategies, sharpening tactical preparation, or uncovering new insights about opponents, we aim to equip our partners with tools that genuinely move the needle.
Because we believe high-quality data shouldn’t be a luxury. It should be part of how football is played, coached, and evolved, everywhere.
And that’s what we’re here to support, frame by frame.

